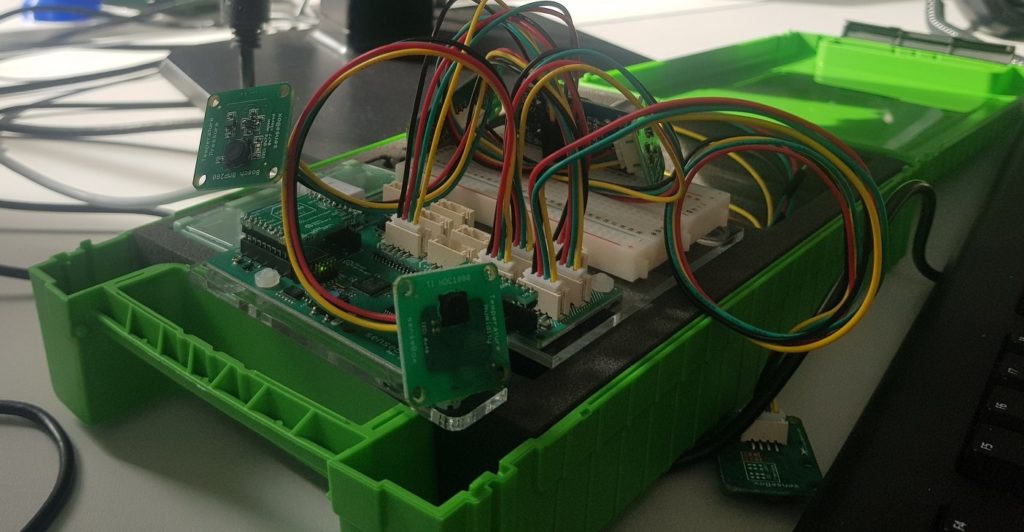
Sensebox 8 – Analyse the data from the SenseBox
With the SenseBox, citizens, e.g. schoolchildren, can measure environmental data on climate, air quality, traffic volume, noise pollution and much more on a location-specific basis and thus contribute to more accurate statements about local environmental phenomena. In a previous step, the children transfer the data into the openSenseMap. In this learning scenario, the aim is to retrieve data from a senseBox from the opensenseMap. Data from a specific time period and from different sensors can be downloaded. Furthermore, it is possible to retrieve the measurement data of the senseBox via the opensensemap API. For this purpose, the programme “Postman” is used to retrieve the data via the API. So, two possibilities are presented how to access the data of the senseBox on the opensensemap: The csv or the JSON file is to be extracted and evaluated in Excel. Furthermore, the learning scenario also includes a first simple data analysis with statistical tools such as mean, minimum and maximum. The data analysis should be guided by the research questions proposed in the previous learning scenario.
| Authors | Annika Nowak & Jan Pawlowski | ||||
| Subjects | Informatik & Physik & Mathematik | ||||
| Durance | 120 minutes | ||||
| Pedagogical approach | Explorative approach | ||||
| Competencies | Data transformation (e.g. data conversion and different data formats) Evaluation of data Handling data (e.g. data in different data formats) Data analysis | ||||
| Grades | 5-9 | ||||
| Link zu den Arbeitsblättern | Arbeitsblatt A Arbeitsblatt B Lernszenario 23 |